
Monitoring Tools In Linux / Ubuntu
Some of monitoring tools in linux / ubuntu.
Some of linux command which can be used as monitoring memory and cpu usage disk and network monitoring etc.
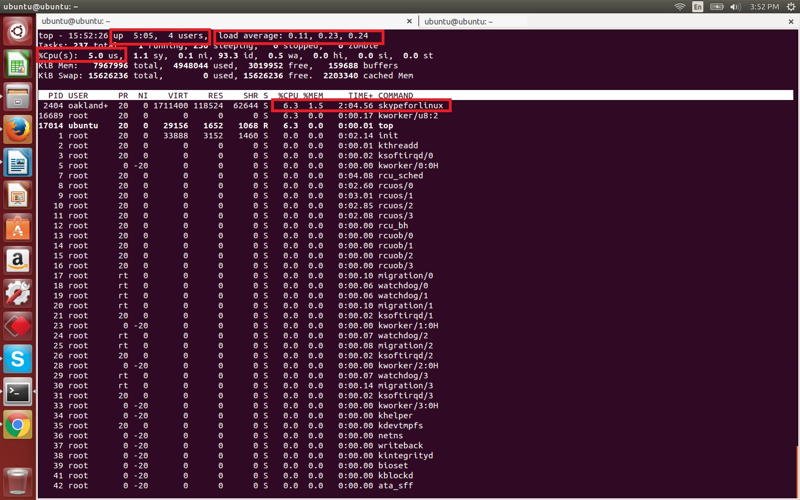
1. Top
This command used to check cpu and memory utilization process wise.
Open a terminal and execute:
top
2. Htop
Htop command is well refine and have extra feature of top command.it have very good looking use interface.
Open a terminal and execute:
sudo apt-get install htop
htop
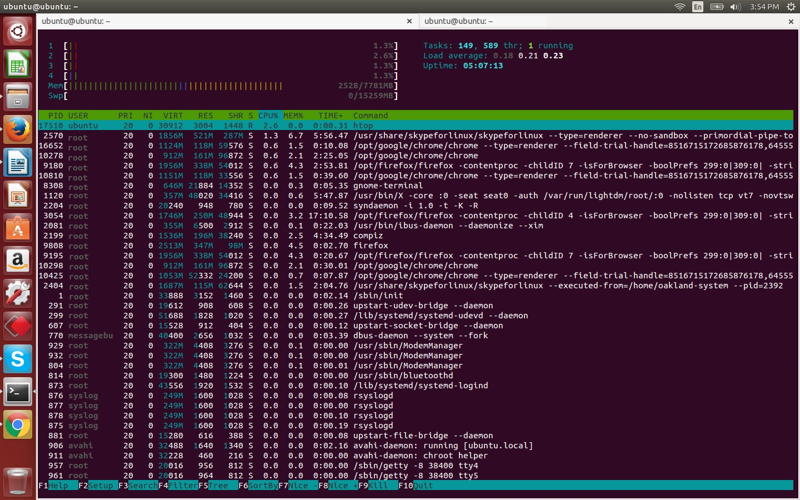
Here are some shortcuts to configure htop output interactively.
M: Sort processes by memory usage
P: Sort processes by processor usage
?: Access help
k: Kill current/tagged process
F2: Setup htop. You can choose display options here.
/: Search processes
Also use man command for help
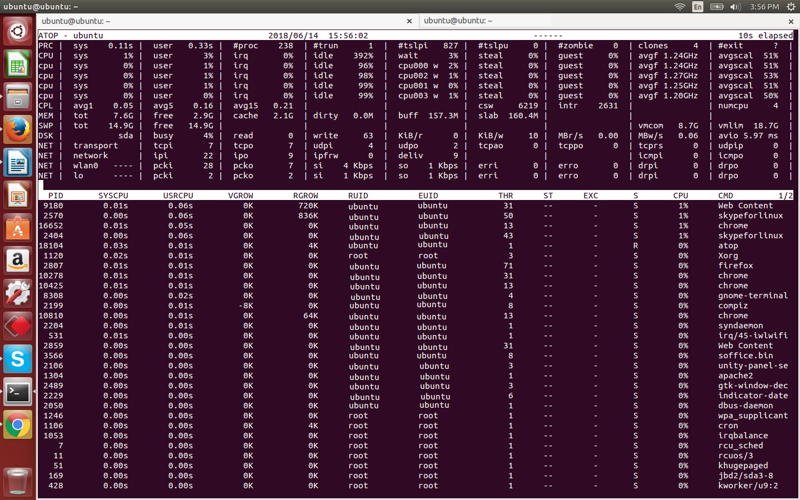
3. Atop
Atop shows the current usage levels of cpu, memory, disk and network along with a list of processes sorted by cpu usage in descending order.
sudo apt-get install atop
atop
4. Nmon
Nmon is used to monitor cpu, memory, network, disk usage and process list on a single screen. We can generate spreadsheet file form this report.
sudo apt-get install nmon
nmon
5. Glances
Glances is similar to Nmon that report statistics on cpu, memory, network, disk and processes.
Glances gives a quick overview of system usage on Linux
At the moment, packages exist for the following distributions
Arch Linux
Debian (Testing/Sid)
Fedora/CentOS/RHEL
Gentoo
Ubuntu (13.04+)
Void Linux
So you should be able to install it using your favorite package manager.
Install glances on Ubuntu or Debian
sudo apt-get install glances
Install glances on Fedora or CentOS
sudo yum install glances
CentOS users need to first setup the epel repository and then install using yum as shown above.
Or install it from Python Package Index repository.
# fedora/centos
sudo yum install python-pip
sudo pip install glances
Using glances
Once installed, start using it right away. Just type in the name and hit enter.
glances
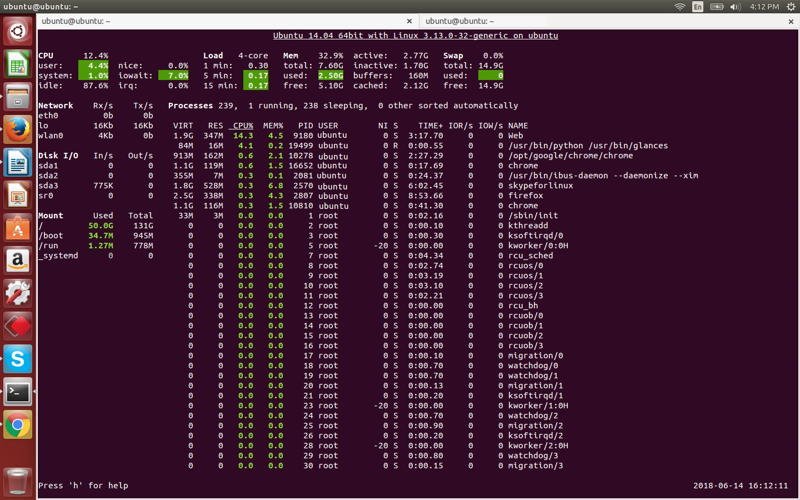
The user interface is interactive and you can gear it with keyboard shortcuts. Here is a list
The output is color highlighted. Green indicates optimum levels of usage whereas red indicates that the particular resource is under heavy use.
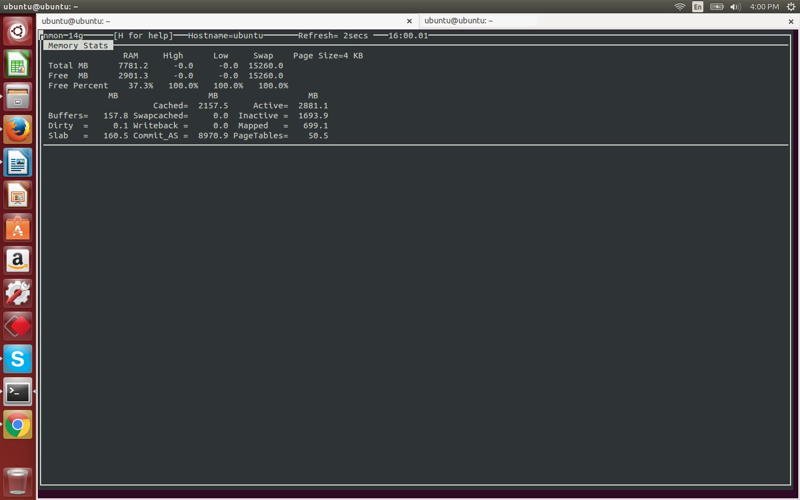
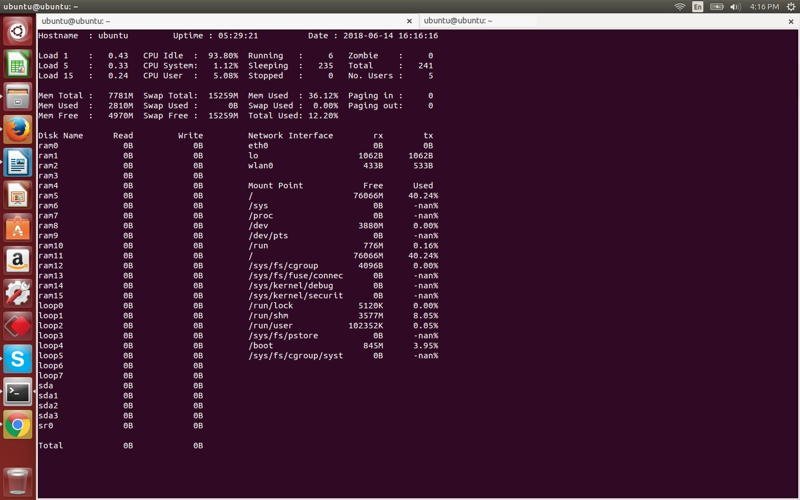
6. Saidar
Saidar is the simplest of all tools. The output includes statistics on CPU, processes, load, memory, swap, network I/O, disk I/O, and file system information. The output does not mention the running processes at all.
Install saidar on ubuntu/fedora/centos
Ubuntu/Debian
sudo apt-get install saidar
Fedora/CentOS
sudo apt-get install statgrab-tools
Using Saidar
Launch saidar by simply typing the name.
saidar
You May Also Enjoy Reading This …